Article Source
The Review Process for NIPS 2016
In an effort to bring transparency to the NIPS 2016 reviewing process, we describe in this page the main steps and the new features we implemented. This is the result of the joint effort of the program chairs (Ulrike von Luxburg and Isabelle Guyon) and the program team (Krikamol Muandet and Behzad Tabibian, partly also Rohit Babbar). We are most grateful to our 100 Area Chairs and the 3400 Reviewers for all their input and support. We are much indebted to Neil Lawrence for sharing his scripts from the NIPS 2014 conference (documented in his blog). Thanks also to the NIPS Board for their input, though they may not endorse everything we did, and the CMT support team. Last but not least, thanks to all the 6000 authors who contributed their time to prepare alltogether 2500 papers for this year’s NIPS. We hope to see many of you at the conference!
Our design of the NIPS 2016 review process follows two main guiding principles:
- Ensuring the program quality.
- Inventing new procedures that will scale with the ever-growing numbers of submissions.
Selection of Area Chairs
Area Chairs (ACs) are the backbone of the NIPS reviewing process. Each AC typically handles 20-30 submissions. Hence, we needed to recruit about 100 area chairs. As it is impossible to intimately know all the diverse research areas covered by NIPS, we came up with the following procedure:
- We asked the NIPS Board and all ACs of the last two NIPS conferences to nominate potential ACs for this year. In this way, we covered the whole variety of NIPS topics, and obtained qualified suggestions. We obtained around 350 suggestions.
- We asked the NIPS Board to go through the list of suggested ACs to vote in favor of suggested ACs.
- We accounted for the distribution of subject areas of submitted papers of the previous NIPS conference.
- Combining all this input we compiled a final list of ACs, by the end of January we had recruited exactly 100 ACs.
- In a later step, we formed “buddy pairs” among the ACs. Based on the ACs preferences, each AC got assigned a “buddy AC”. These buddy teams were important in the decision process (see below).
Selection of Reviewers
The process of recruiting reviewers is very time consuming, it essentially went on from January until the submission deadline end of May. New this year, we had two kinds of reviewers, “invited senior reviewers” and “volunteer reviewers”:
- Invited Experienced Reviewers: We asked all ACs to suggest at least 30 reviewers each who have completed the PhD degree. We obtained 2500 suggested experienced reviewers. We invited all of them, and 1100 accepted. We then asked all confirmed reviewers to “clone themselves” by inviting at least one researcher with a similar research background and at least as good qualification as themselves. This resulted in another 500 experienced reviewers.
- Volunteer Author-Reviewers: An obvious procedure to let the number of reviewers scale with the number of submissions is to ask authors to become reviewers as well. This idea has been used in the past, for example to evaluate NSF grant proposals or to allocate telescope time. To implement this idea, without constraining unwilling authors, we requested authors to volunteer during the submission process by naming at least one author as “volunteer reviewer”. We ended up with 3000 nominations. The next day we invited all of them formally through CMT, and about 2000 of the volunteers accepted the invitation and were involved in the review process. One of the nice effect of including author-reviewers was to add transparency to the review process as at least one author per paper experienced it.
An obvious difficulty was that we could not control the quality of the volunteer author-reviewers. We addressed this by keeping invited reviewers and volunteer reviewers in two separate pools. In the end, we had the following number of reviewers:
- Pool 1: Invited experienced reviewers:
- senior researcher / faculty: 930
- junior researcher / postdoc: 600
- Pool 2: Volunteer author-reviewers:
- senior researcher / faculty: 400
- junior researcher / postdoc: 250
- PhD students: 1200
Paper Submission
We received about 2500 papers by the submission deadline. As is often the case, most submissions were made right before the deadline:
The deadline was strictly enforced, regardless of personal situations, we are sorry for those who missed it. During the next couple of weeks, a number of papers were withdrawn or deleted by the authors (for example, because they had been submitted twice, or remained unfinished at the time of the deadline). By the end of the review process, we were left with 2406 submitted papers.
Paper Assignment to Area Chairs
The assignment of papers to Area Chairs was a multi-step procedure:
- A first similarity score between all ACs and all submitted papers was computed based on subject areas and the Toronto paper matching scores.
- Additionally, ACs could bid for papers they wanted to handle.
- Then papers were assigned automatically, taking into account the similarity scores and the bidding scores.
- Finally, ACs could decline handling certain papers for miscellaneous reasons, including conflicts of interest. These papers were re-assigned by hand by the program chairs.
Paper Assignment to Reviewers
The assignment of papers to reviewers was largely new this year:
- The AC of each paper was responsible to first assign one senior, highly qualified reviewer “by hand” (either from Pool 1 or at the discretion of the AC).
- Two more invited reviewers (from Pool 1) were assigned automatically to each paper, using a combination of subject similarity, reviewer’s bidding preferences, and similarity scores computed by the Toronto paper matching service.
- Three volunteer reviewers (from Pool 2) were assigned automatically to each paper by a similar procedure as in Step 2.
- The ACs were asked to check whether each of their assigned papers had at least 3 really competent reviewers, and could manually change reviewer assignments (either from Pool 1 or at their discretion) to ensure that this is the case.
- During the decision process, additional “emergency reviewers” were invited to provide complementary reviews if some of the reviewers defected or no concensus could be reached among the selected reviewers.
Review Profiling
In the end, we received 13,674 reviews from 3242 reviewers. On average, each reviewer provided 4.05 reviews, and each paper was reviewed 5.97 times:
Scoring Method
We completely changed the scoring method this year. In previous years, NIPS papers were rated using a single score between 1 and 10. This did not allow reviewers to give a differentiated quantitative appreciation on various aspect of paper quality. Furthermore, the role of the ACs was implicitly to combine the decisions of the reviewers (late integration) rather than combining the reviews to make the final decision (early integration). Introducing multiple scores allowed us to better separate the roles: the reviewers were in charge of evaluating the papers; the ACs were in charge of making (rational) decisions based on all the evaluations. Furthermore the multiple specialized scores allowed the ACs to guide reviewers to focus discussions on “facts” rather than “opinion” in the discussion phase. We asked reviewers to provide a score in each of the following categories:
- Technical quality
- Novelty/originality
- Potential impact or usefulness
- Clarity and presentation
The grades were on a scale 1-5:
- 5 - Award level (1/1000 submissions)
- 4 - Oral level (top 3% submissions)
- 3 - Poster level (top 30% submissions)
- 2 - Sub-standard for NIPS
- 1 - Low or very low
We also asked the reviewers to flag “fatal flaws” and declare their overall “level of confidence”. The scores had to be complemented by justifications in designated text boxes.
The following histograms show the distribution of average scores for all papers (where the average is taken over all reviews for each paper).
The ACs were given a lot of flexibility to use the scores. In particular, the decisions were not based on thresholding an overall score (we did not even attempt to compute such an overall score). The text explanations in the reviews, the rebuttal, and the discussions among reviewers played an important role.
Author rebuttal and discussions
Once most of the reviews were in, all authors had the possibility to look at the reviews and write a rebuttal (some reviews were still missing at this point, but it would not have helped to delay the rebuttal deadline, the missing reviews trickled in slowly). Subsequently, area chairs and reviewers engaged in detailed discussions about the pros and cons of the submitted papers. To support the ACs, we sent individual reports to all area chairs to flag papers whose reviews were of too low confidence, too high variance or where reviews were still missing. In many cases, area chairs recruited additional emergency reviewers to increase the overall quality of the decisions.
Decisions
Two novel elements were introduced this year in the decision process:
- No conference calls between ACs and program-chairs: we introduced a decentralized, scalable decision process relying on AC buddy-pairs.
- No poster spotlights. Instead we doubled the number of oral presentations by introducing two tracks.
The decision process was largely based on AC “buddy” suggestions. The first round of decisions happened in a moderated, but decentralized fashion: each area chair worked with her/his “buddy”. The two of them were responsible for all papers in their joint bag, and made their decisions jointly, following guidelines given by the program chairs. Difficult cases were taken to the program chairs (among them, cases conflicts of interest and plagiarism). To harmonize decisions across buddy pairs, all area chairs had access to various statistics and histograms over the set of their papers and the set of all submitted papers. In a second round, the program chairs consolidated the decisions. This mainly affected the selection of oral presentations, with the goal to exhibit the diversity of NIPS papers and to expose the community with novel and thought provoking ideas. All in all, 568 papers got accepted to the conference, among them 46 oral presentations.
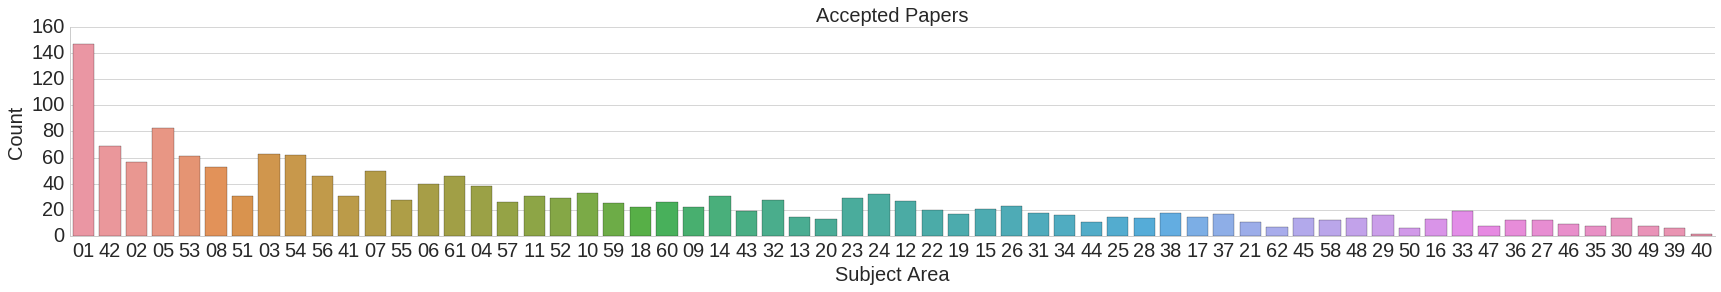
Below is a plot of the distribution per subject areas (combined primary and secondary subjects), both for submitted papers and for accepted papers. Of course the proportions are not identical, but the plots do not show any systematic bias in favor or against certain areas.
| 1 | Deep Learning or Neural Networks | 2 | Large Scale Learning and Big Data | 3 | Convex Optimization |
|---|---|---|---|---|---|
| 4 | Clustering | 5 | Learning Theory | 6 | Graphical Models |
| 7 | Online Learning | 8 | Sparsity and Feature Selection | 9 | Reinforcement Learning Algorithms |
| 10 | Kernel Methods | 11 | Matrix Factorization | 12 | Bandit Algorithms |
| 13 | Component Analysis (ICA,PCA,...) | 14 | Stochastic Methods | 15 | Gaussian Processes |
| 16 | MCMC | 17 | Nonlin. Dim. Reduction and Manifold Learning | 18 | Time Series Analysis |
| 19 | Model Selection and Structure Learning | 20 | Multitask/Transfer Learning | 21 | Bayesian Nonparametrics |
| 22 | Spectral Methods | 23 | Variational Inference | 24 | Combinatorial Optimization |
| 25 | Semi-supervised | 26 | Structured Prediction | 27 | Ensemble Methods and Boosting |
| 28 | Graph-based Learning | 29 | Active Learning | 30 | Ranking and Preference Learning |
| 31 | Similarity and Distance Learning | 32 | Information Theory | 33 | Game Theory and Econometrics |
| 34 | Regularization and Large Margin Methods | 35 | Causality | 36 | (Cognitive/Neuro) Perception |
| 37 | (Cognitive/Neuro) Neural Coding | 38 | (Cognitive/Neuro) Theoretical Neuroscience | 39 | (Cognitive/Neuro) Reinforcement Learning |
| 40 | (Cognitive/Neuro) Language | 41 | (Application) Object and Pattern Recognition | 42 | (Application) Computer Vision |
| 43 | (Application) Natural Language and Text | 44 | (Application) Signal and Speech Processing | 45 | (Application) Social Networks |
| 46 | (Application) Information Retrieval | 47 | (Application) Web Applications and Internet Data | 48 | (Application) Collab. Filtering / Recom.Sys. |
| 49 | (Application) Privacy, Anonymity,Security | 50 | (Application) Bioinformatics and Systems Biology | 51 | (Other) Classification |
| 52 | (Other) Regression | 53 | (Other) Optimization | 54 | (Other) Probabilistic Models and Methods |
| 55 | (Other) Machine Learning Topics | 56 | (Other) Unsupervised Learning Methods | 57 | (Other) Applications |
| 58 | (Other) Cognitive Science | 59 | (Other) Bayesian Inference | 60 | (Other) Neuroscience |
| 61 | (Other) Statistics | 62 | (Other) Robotics and Control |
Exhibition of rejected papers
With a review process of this scale it is unavoidable that among the rejected papers there are hidden gems that simply drowned in the review process. For this reason we organized an exhibition of rejected papers, in a spirit similar to the Salon de Refuesés. In this exhibition, you can find a list of those rejected NIPS submissions whose authors decided to take part in the exhibition.