Article Source
Quick & Simple Call Graphs in Python
Visualize & understand functional relationships within Python codebases
A call graph is a type of dependency graph that just shows which functions within a program are calling other functions (although it can also show other relationships such as definitions and file groupings). When taking over or maintaining a Python project, or coming back to a project you wrote a while back, they can sometimes be useful for quickly visualizing or getting a reminder of how the code is structured. They can also be especially useful in an educational setting.
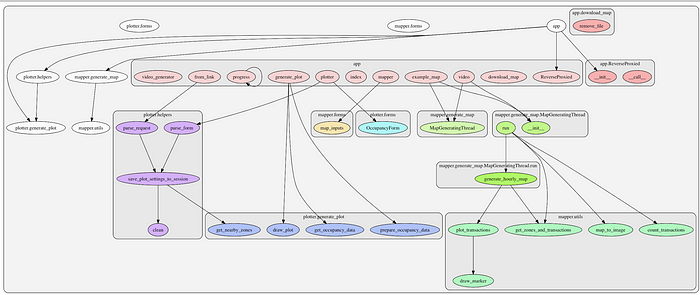
A call graph generated for a small Flask web-app using pyan and Graphviz. Not all of the dependencies are captured perfectly, but it’s 95% there and very readable.
The problem is that while there are several tools that can generate these graphs for Python 2 & 3, most of them are either abandoned or extremely complex to use, many requiring themselves to be written into your actual code. Some also require running the code itself and waiting to see what functions are actually called, which can be impractical, especially with data science projects where you might have to wait for a lot of data processing tasks.
So, here’s a quick and dirty solution to generate a nice-looking Python call graph for an entire project within a few seconds on macOS. First ensure that you have Graphviz installed (e.g. brew install graphviz), then run these two lines:
` pip install git+https://github.com/ttylec/pyan ` ` alias pygraph=’find . -iname “*.py” | xargs pyan –dot –colored –no-defines –grouped | dot -Tpng -Granksep=1.5 | open -f -a /Applications/Preview.app’ `
Then, simply navigate to the root directory of any Python project and type pygraph. That’s it!
That’s what? What did that do?
This uses the pyan module currently maintained by David Fraser (forked from some other original authors), that I found thanks to his helpful StackOverflow answer. It operates by simply parsing the code without running it, so as far as I understand it it’s not guaranteed to catch 100% of all dependencies or unusual situations, but it’s fast and seems to work very well at least for smaller projects.
However, this module itself is not super simple to install and use, hence the quick solution above. All this does is first install pyan from a forked pip-installable forked repository (thanks I believe to Tomasz Tylec). Then it’s just a bash alias that finds all Python files within a directory, passes them to pyan along with some command-line options to generate a Graphviz file, then uses Graphviz’s module dot with some more options to generate a readable graph, which is finally directly passed to Preview.
You could put the last line into your ~/.bash_profile, so that this command is remembered. In the case the graph is very complex or you just want a subset of the dependencies, you could also define a function:
`
pygraph() { pyan “$@” –dot –colored –no-defines –grouped | dot -Tpng -Granksep=1.5 | open -f -a /Applications/Preview.app; }
`
Then you can also call \pygraph [your specific files], which will draw a subgraph.