Article Source
Have you ever wondered what might be reason behind videos, memes and posts going viral in this social age. What makes them propagate throughout the world and make them popular. Let’s analyze this phenomenon with underlying structures behind the internet i.e. the network of people. And try to understand this phenomenon based on one property only “connectedness” for simplicity.
In this article we will learn how to use network datasets for extracting information and resources from where we can get them. Which libraries can be used to analyze them. Also later on, we will try to understand connectedness property in graphs and implications of it. Main aim of this article is to lay foundation of concepts of network datasets and show some interesting properties related to it..
Getting Started With Network Datasets
Real World Networks developed with human related data often exhibit social properties i.e. patterns in graph from which human behavioral patterns can be analyzed and mined for valuable information. The Power of which is being used by all the companies to maximize their throughput. Well to start with, all of us use different social media networks either to find jobs, express our views, make friends, stay connected, gaming, dating and many more things. Also, the domain is not restricted to these social sites instead business decisions for marketing & sales, supply-chain management and advertisements gets influenced by knowledge of analyzing networks.
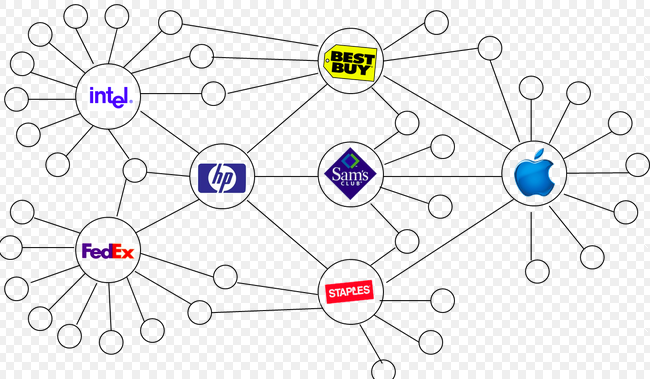
Network of Enterprises in a functioning Supply-Chain mechanism.
Now, these networks are not random networks where a node gets added randomly, they exhibit special properties. What special properties to consider? Let’s take one property for example connectedness. By connectedness we mean that there is no isolated vertices in the existing graph.
Connectedness
Are these large scale real world social graphs connected ? Yes, if not definitely the probability of them being not connected is very less. Consider a case, in a class there are 50 students each making only three friends (quite an unsocial class 😉). What is the probability of this being disconnected at a given instance?
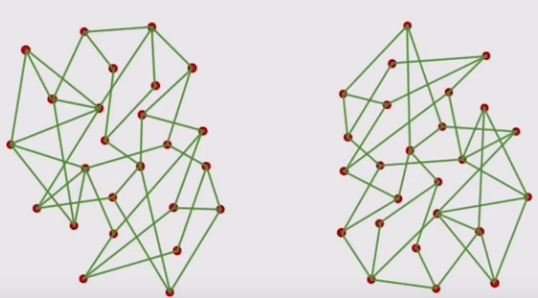
Solution: For simplicity, let’s say class gets divided into two groups of m & n. P(E) = 1/(m*n). This highly improbable event in deed with P(E(m=25,n=25)) = 0.0016.
This was the case for small class imagine it for very large scale networks where ‘m’ & ‘n’ goes to very large values, event of graph being disconnected is highly improbable for real life networks. This connectedness property can be analyzed with following stated problem statement.
Given ‘n’ nodes, what is the minimum number of edges that needed to be added in a completely disconnected graph, So that, graph becomes connected in nature? It can also be stated as when will a graph have no isolated vertex, provided edges are inserted uniformly at random?
If we solve this problem using probabilistic analysis, the results will be as follows : if we put n*log(n) edges than probability of this graph being disconnected is (1/n)². Since, this n being very large on real world networks, it is an improbable event to occur. Well, what are implication of such a property ? Take one such case where all facebook friends are connected each containing their respective information.
Implications
Consider the case of Cambridge Analytica (excluding political conversation). Since, based on our assumption that the network of friends in US is connected on facebook, with a loophole in Facebook API they were able to access raw data of 87 million people by analyzing data about friends of facebook users who took the quiz. Just to talk about the scale of impact here 270,000 users took the quiz using which they were able to access 322 times more data from that. Property of accessing information about friends of friends and chain goes on. Also, which is 27% of entire population of USA, just from a simple quiz. That data then being used for malicious reasons to influence democracy. Imagine data handled by big tech Giants and the power that they hold now from analytics of data from these social networks. So, let’s get a glimpse onto this topic and its analysis.
In what shape or form this data exists? This thing is quite intuitive that it will store information about graphs with many nodes and edges. Also, each of which will exhibit some special properties that can be stored as attributes and weights. Now, let’s take a look at different forms this data is represented.
Datasets
Let’s see different format of datasets that are available to us for analyzing.
- [CSV Format: Data being presented in either Edgelist format or Adjacency List format. Edge List format contains two/three values in each line (To, From, [Weight]) node giving an idea about edges that exist in graph with any weight if attached. In Adjacency List first value in a row is source node and succeeding nodes are the ones to which edge is present. For example: [Source, Node1, Node2, …].]
- [GML Format: One of the most common formats as provide huge flexibility for graphs to store information. It is modeling language to store information about node, edges, labels, attributes etc.]
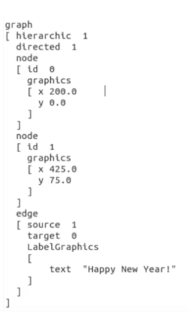
GML Example with graph attribute, node attribute and edge labels.
- Pajek Net Format: Uses .NET extensions. There are two columns present in this format one vertices which specifies label of nodes another specifies edges between nodes. If nodes don’t have any labels then row entries below vertices column can be skipped. Also, an attribute value can be added if needed.
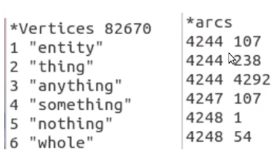
Below vertices column attribute labels and below arcs column edges between nodes are specified.
- GraphML Format: Uses xml tag structures to store information about a graph ends with .graphml extension. Here, graphml tag store metadata about the graph, graph tag for attributes about graph. Node tag, which specifies all the properties about nodes and than edge tags are there to give edge specifications. Also, an optional key tag can be used to assign weight to edges and attributes to nodes.
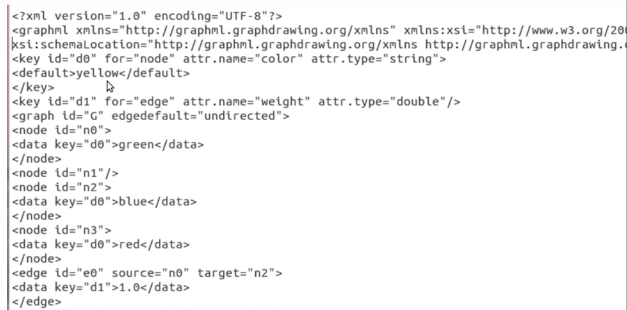 Graph XML format with key tag to provide descriptions about nodes and edges
- GEXF Format: Graph Exchange XML Format, developed by Gephi organization. Much similar to graphXML format. It is a language for describing complex networks structures, their associated data and dynamics. Gelphi tool is also used for easy visualization of network graphs.
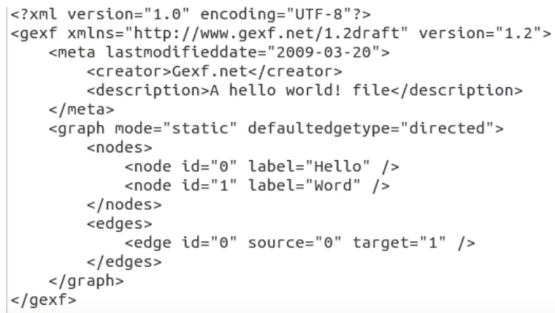
GEXF format, with meta-data, nodes and edges attributes and descriptors.
We can download these datasets from repositories like SNAP, Konect, UCI etc. Also, you can search them Google’s dataset search. For analyzing these datasets using popular python libraries networkx and visualizing MatplotLib is a very good option. Click on specified links for basic tutorials to get started with, otherwise you can also follow along with coding examples in this article. Here, is an example to get started with.
# Draws circular plot of the network
import matplotlib.pyplot as plt
import networkx as nx

G = nx.karate_club_graph() # data can be read from specified stored social graph in networkx library.
print("Node Degree")
for v in G:
    print (v, G.degree(v))
nx.draw_circular(G, with_labels=True) # different plot layouts possible
plt.show()
Minor NetworkX Demo
Consider case of a popular karate club known as Zachary karate club where two teachers had a conflict and tried recruiting members in each others group. It is clear that there will be two groups formed at the end. Can we predict what those groups are? Which person is on whose side, by properties of graph?
Now, inter-community edges have high betweenness i.e. number of shortest path between any two nodes are high. An intuition for this is let’s consider two cities connected by a bridge, in order to connect any two points b/w two cities we must pass from that bridge. Resulting in that bridge being used always to connect two communities like in above case of two groups getting formed after fight.
These edges keeping the graph connected and acting as bridges. What we can do is remove these edges upto a safe limit and observe the communities that exist, if the graph becomes disconnected at that point. Like, if we remove that bridge b/w towns they will be disconnected. Similarly here, consider two groups in Zachary karate clubs are connected by few bridges which might be result of earlier friendship existing b/w those two people.
import networkx as nx  # Python 2.x, NetworkX 2.0import networkx as nxdef edge_to_remove(G):  # high betweenness edges are removed first
 dic1 = nx.edge_betweenness_centrality(G)
 list_tuples = dic1.items()
 list_tuples.sort(key =lambda x:x[1], reverse = True)
 return list_tuples[0][0] #(a,b)def girvan(G): # returns number of connected components
 c = nx.connected_component_subgraphs(G)
 i=0
 while(i<11): # you can experiment with different values
  G.remove_edge(*edge_to_remove(G))
 return cG = nx.karate_club_graph() # imports popular zachary karate club
c = girvan(G) # After enough edge removal, groups printedfor i in c:
 print 'Group Nodes: ', i.nodes()
 print 'Number Of Nodes: ', i.number_of_nodes()Output :Group Nodes:  [0, 1, 3, 4, 5, 6, 7, 10, 11, 12, 13, 16, 17, 19, 21]
Number Of Nodes:  15
Group Nodes:  [32, 33, 2, 8, 9, 14, 15, 18, 20, 22, 23, 24, 25, 26, 27, 28, 29, 30, 31]
Number Of Nodes:  19
Let’s analyze the connectedness property in more detail and see what interesting information can be derived from it when social constructs are applied on it. What more can we leverage? Take this case of Daman, who is from Delhi and wants to connect to Lana from L.A. in 1970 with post or mailing service but only with the help of friends or friends of friends. Now, it might be reasonable to assume all the communities at that time were connected, is the friendship graph of world connected? Based on our argument above it is reasonable to assume world is connected. In order to deliver a message how many hops is required on an average i.e. how many intermediate people are required on an average to deliver his letter?
Six degrees of separation
Only six hops on an average is required for such a message transfer. Meaning only six people on an average can deliver his message, such small number of friends required to deliver a far out message is incredible. But, why such less hops ?
The answer is homophily(similar nodes connect and form communities with high clustering co-efficient) and weak ties(generally bridges between two such cluster). Meaning the people in neighborhood are very well connected but at the same time they have connections to far out node which are less probable but still feasible. Like one of your friend can know someone in California, other one knows people in Europe and so on.
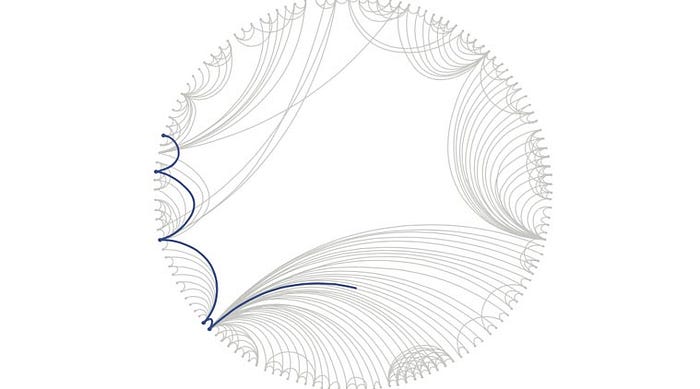 From above structure homophily and weak ties are visible. Observe nearby nodes being very well connected and some far fetched links in network.
Both these are discussed in above example of Zachary club with two communities resulted because of homophily two similar nodes getting connected and high betweenness edges as weak ties as some friends might be there even in opposite groups.
Six Degrees of Kevin Bacon is a parlor game on this concept. Where, movie buff challenge each other to connect dots to Kevin Bacon with smallest hops. Image Courtesy: Lostpedia
In real world networks, it can be understood with a stochastic explanation like there is less probability forming long ties as compared to a smaller one. Reason can be geographic like in above case resulting in less neighborhood overlap i.e. with more distance less probable links of friendship are extended.

Probability decays dth power of dimensionality of space
How to detect it in a network dataset? Analyze only the average shortest path length which will be closer to 6 or will be drastically small compared to network size. That would mean that graph/network exhibit small world phenomenon.

Where V is set of nodes in G. d(s,t) is the shortest path from s to t, n is number of nodes in G.
First read any desired graph in any format you are comfortable in, refer documentation. Then use the following function in code snippet.
# Networkx Examples
G =nx.karate_club_graph() # Can be applied on different graphs
print(nx.average_shortest_path_length(G))
G = nx.florentine_families_graph()
print(nx.average_shortest_path_length(G))
G = nx.davis_southern_women_graph()
print(nx.average_shortest_path_length(G))
After this let’s apply it onto some real dataset lets say facebook_combined dataset from SNAP containing data in edgelist format from all ego-nets. And try to simulate Cambridge-analytica’s case study, how users were connected to each other, will also recommend to visualize this with matplotlib.
G = nx.read_edgelist('Desktop/facebook_combined.txt')
print(nx.average_shortest_path_length(G)) # Takes 4 mins approx.
[Output]: 3.6925068497 # Confirms our statement above.
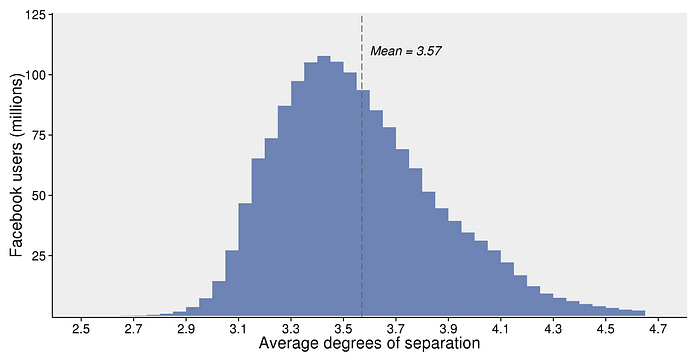
Above code almost replicate study done by facebook research.
This reduced distance from 6 can be attributed to the fact it much easier to connect due to globalization that has happened with world being more connected than ever as compared to when Milgram conducted his experiment.
Now, what’s the interpretation of this result? A very large scale graph with very less average shortest path property. It would mean that we can search relation between any two nodes in O(k) constant time. This is also known as decentralized search. Or myopic search as we can see only upto a certain extent from our connections. This will allow us extract information b/w any two nodes at any distance with a constant time lookup.
Imagine the implications of such phenomenon, this will result in very fast rapid exchange of information b/w the nodes independent of vicinity. This can clearly be seen with Vines, Memes getting viral throughout the internet and probably as a result of this phenomenon ‘Break the Internet’ term was coined.
Conclusion
Analyzing properties of real world large networks specific to a domain gives advantages in data mining capabilities when we are aware of such special properties that these graphs will exhibit. Like connectedness there are many more important properties to explore like Power Law, Cascading Effect, Link Prediction, Pseudo cores, Spatial and Community arrangements, Evolutionary networks each one deserving separate discussion. Knowledge of these does help in reducing the effort working with these large network datasets. Few important ones I’ll definitely discuss in upcoming articles on more real use-cases. Also, will definitely encourage you to read books like Mining The Social Web & Network, Crowd and Markets Reasoning about a Highly Connected World. Thanks to SRS Iyengar for wonderful course on Social Networks!!