Article Source
22 Python libraries for Geospatial Data Analysis
How to harness the power of geospatial data
Spatial data, Geospatial data, GIS data or geodata, are names for numeric data that identifies the geographical location of a physical object such as a building, a street, a town, a city, a country, etc. according to a geographic coordinate system.
From the spatial data, you can find out not only the location but also the length, size, area or shape of any object.
An example of a kind of spatial data that you can get are: coordinates of an object such as latitude, longitude, and elevation.
Geographic Information Systems (GIS) or other specialized software applications can be used to access, visualize, manipulate and analyze geospatial data.
Some examples of geospatial data include:
1. Vectors and Attributes
Points, lines, polygons, and other descriptive information about a location. Understanding Vector Data
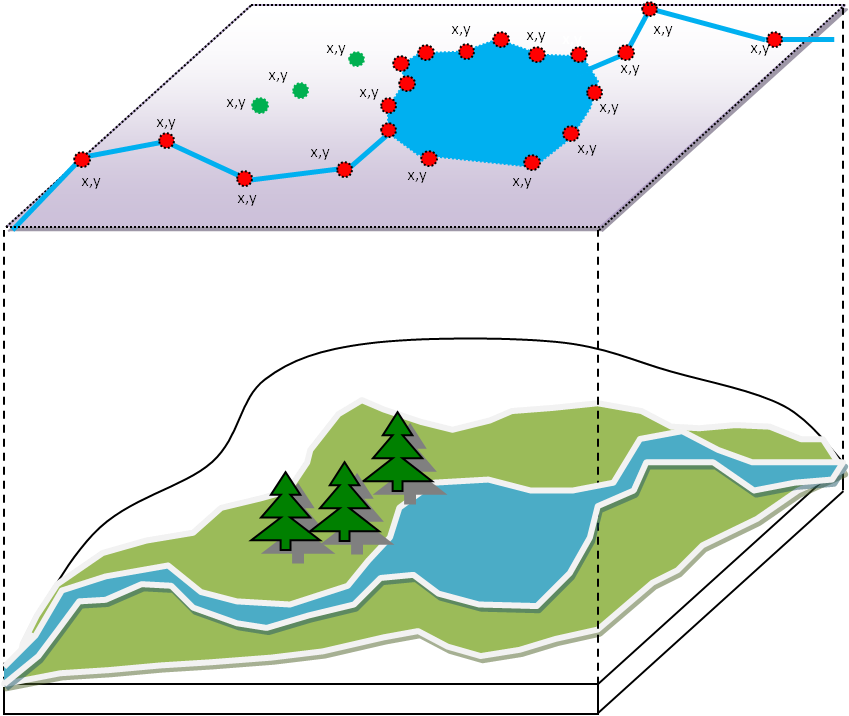
Vector data is a representation of a spatial element through its x and y coordinates. The most basic form of vector data is a point. Two or more points form a line, and three or more lines form a polygon.
The simplest form is to include one or more extra columns in the table that defines its geospatial coordinates. More formal encoding formats such as GeoJSON also come in handy.
GeoJSON, an extension to the JSON data format, contains a geometry feature that can be a Point, LineString, Polygon, MultiPoint, MultiLineString, or MultiPolygon.
There are several other libraries available for representing geospatial data that are all described in the Geospatial Data Abstraction Library (GDAL).
2. Point Clouds
Collected by LiDAR systems, they can be used to create 3D models.
Understanding Point Cloud data from LiDAR systems
3. Raster and Satellite Imagery
Get a birds eye view of what the Earth looks like via high resolution imagery.
Raster data is used when spatial information across an area is observed. It consists of a matrix of rows and columns with some information associated with each cell.

An example of raster data is a satellite image of a nation or a city represented by a matrix that contains the weather information in each of its cells.
There are several ways that you can work with raster data in Python.
One recent package that is user-friendly is xarray, which reads netcdf files.
Terminology
- shapefile: data file format used to represent items on a map
- geometry: a vector (generally a column in a dataframe) used to represent points, polygons, and other geometric shapes or locations, usually represented as well-known text (WKT)
- polygon: an area
- point: a specific location
- basemap: the background setting for a map, such as county borders in California
- projection: since the Earth is a 3D spheroid, chose a method for how an area gets flattened into 2D map, using some coordinate reference system (CRS)
- colormap: choice of a color palette for rendering data, selected with the cmap parameter
- overplotting: stacking several different plots on top of one another
- choropleth: using different hues to color polygons, as a way to represent data levels
- kernel density estimation: a data smoothing technique (KDE) that creates contours of shading to represent data levels
- cartogram: warping the relative area of polygons to represent data levels
- quantiles: binning data values into a specified number of equal-sized groups
- voronoi diagram: dividing an area into polygons such that each polygon contains exactly one generating point and every point in a given polygon is closer to its generating point than to any other; also called a Dirichlet tessellation
22 Python libraries for Geospatial Data Analysis
Here is the list of 22 Python libraries for geospatial data analysis:
1. Shapely
With shapely, you can create shapely geometry objects (e.g. Point, Polygon, Multipolygon) and manipulate them, e.g. buffer, calculate the area or an intersection etc.
2. Fiona
Fiona can read and write real-world data using multi-layered GIS formats and zipped virtual file systems and integrates readily with other Python GIS packages such as pyproj{.dt .iz}, Rtree, and Shapely.
3. GeoPandas
Geopandas is like pandas meet GIS. It extends the datatypes used by pandas to allow spatial operations on geometric types. Geometric operations are performed by shapely. It further depends on fiona for file access and matplotlib for plotting.
4. GeoPlot
A high-level geospatial plotting library. It’s an extension to cartopy and matplotlib which makes mapping easy: like seaborn for geospatial. This is especially helpful since it builds on top of several other popular geospatial libraries, to simplify the coding that’s typically required.
5. Arcpy
If you use Esri ArcGIS, then you’re probably familiar with the ArcPy library. ArcPy is meant for geoprocessing operations. But it’s not only for spatial analysis, it’s also for data conversion, management, and map production with Esri ArcGIS.
6. Scikit-Image
Library for image manipulation, e.g. histogram adjustments, filter, segmentation/edge detection operations, texture feature extraction etc.
7. SciKit-Learn
The best and at the same time easy-to-use Python machine learning library. Regression, classification, dimensionality reductions etc.
8. Descartes
Enables plotting of shapely geometries as matplotlib paths/ patches. Also a dependency for the geometry plotting functions of geopandas.
9. RasterStats
For zonal statistics. Extracts statistics from rasters files or numpy arrays based on geometries.
10. Rasterio
Rasterio is the go-to library for raster data handling. It lets you read/write raster files to/from numpy{.dt .iz} arrays (the de-facto standard for Python array operations), offers many convenient ways to manipulate these array (e.g. masking, vectorizing etc.) and can handle transformations of coordinate reference systems. Just like any other numpy array, the data can also be easily plotted, e.g. using the matplotlib library.
11. ipyleaflet
If you want to create interactive maps, ipyleaflet is a fusion of Jupyter notebook and Leaflet. You can control an assortment of customizations like loading basemaps, geojson, and widgets. It also gives a wide range of map types to pick from including choropleth, velocity data, and side-by-side views.
12. Folium
Just like ipyleaflet, Folium allows you to leverage leaflet to build interactive web maps. It gives you the power to manipulate your data in Python, then you can visualize it with the leading open-source JavaScript library.
13. Geemap
Geemap is intended more for science and data analysis using Google Earth Engine (GEE).
14. PySAL
The Python Spatial Analysis Library contains a multitude of functions for spatial analysis, statistical modeling and plotting. It is intended to support the development of high-level applications.
15. xarray
Great for handling extensive image time series stacks, imagine 5 vegetation indices x 24 dates x 256 pixel x 256 pixel. xarray lets you label the dimensions of the multidimensional numpy array and combines this with many functions and the syntax of the pandas library (e.g. groupby, rolling window, plotting).
16. PyProj
The main purpose of the PyProj library is how it works with spatial referencing systems. It can project and transform coordinates with a range of geographic reference systems. PyProj can also perform geodetic calculations and distances for any given datum.
17. GDAL/OGR
The GDAL/OGR library is used for translating between GIS formats and extensions. QGIS, ArcGIS, ERDAS, ENVI, and GRASS GIS and almost all GIS software use it for translation in some way. At this time, GDAL/OGR supports 97 vector and 162 raster drivers.
18. RSGISLib
The RSGISLib library is a set of remote sensing tools for raster processing and analysis. To name a few, it classifies, filters, and performs statistics on imagery. My personal favorite is the module for object-based segmentation and classification (GEOBIA).
19. ReportLab
ReportLab is one of the most satisfying libraries on this list. I say this because GIS often lacks sufficient reporting capabilities. Especially, if you want to create a report template, this is a fabulous option. I don’t know why the ReportLab library falls a bit off the radar because it shouldn’t.
20. Imageio
It is a Python library that provides an easy interface to read and write a wide range of image data, including animated images, volumetric data, and scientific formats.
21. MapClassify{.dt .iz}
It implements a family of classification schemes for choropleth maps. Its focus is on the determination of the number of classes, and the assignment of observations to those classes.
22. RTree
It is a ctypes Python wrapper of lib_spatial_index that provides a number of advanced spatial indexing features.